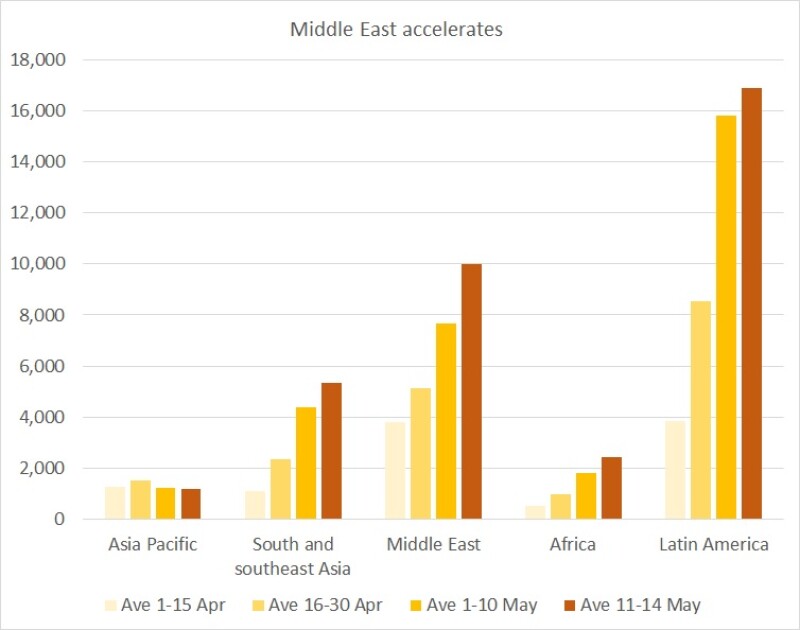
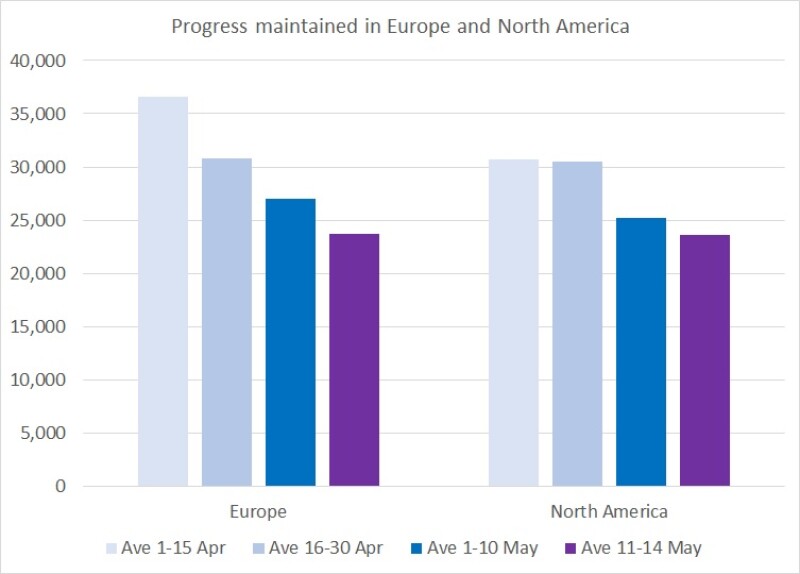
The rate of the disease's spread in the US and Canada has slowed, from an average of around 30,000 new cases a day in April to around 24,000. But the pace in Latin America has accelerated: the region had an average of 17,000 new cases a day on the three days to Thursday.
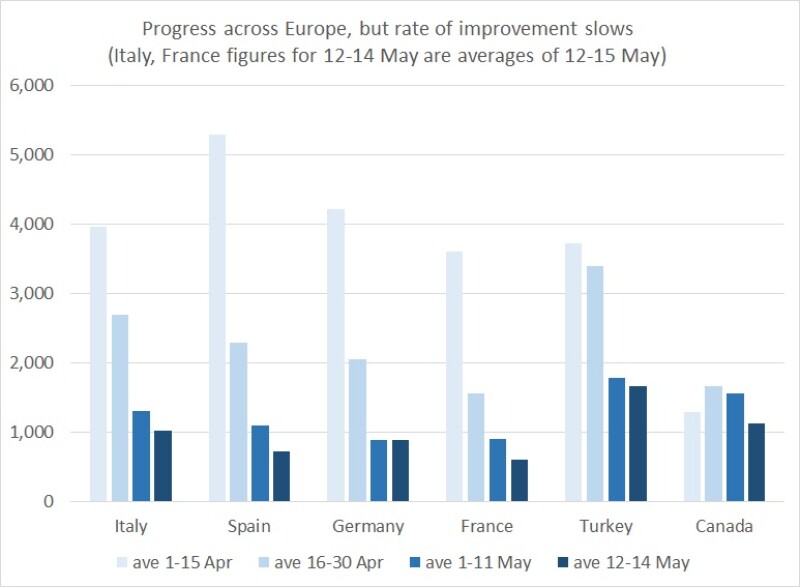
The good news is the relaxation of lockdowns in major continental European countries such as Italy and Spain has not so far led to a fresh spike in Covid-19 cases. Spain has had the odd bad day, but its average new cases on Tuesday to Thursday were just over 700, down from an average of nearly 6,000 in the first half of April.
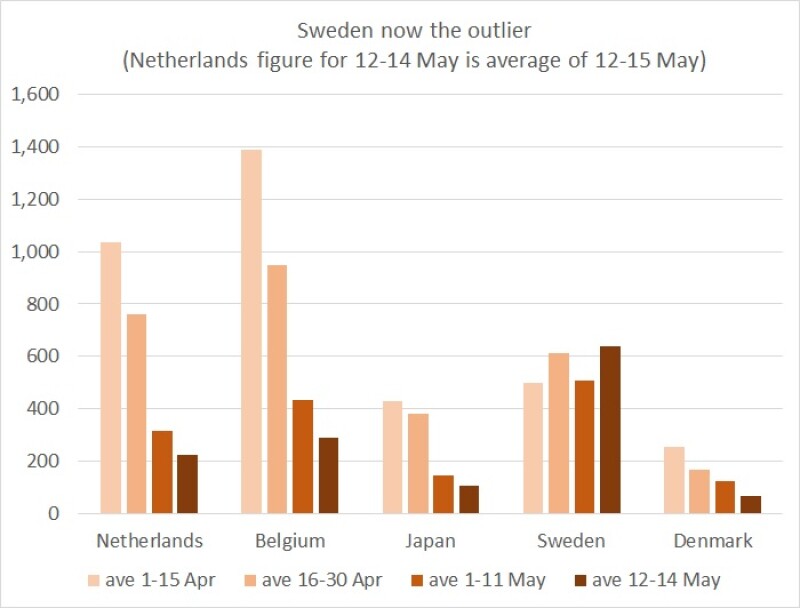
Italy, France and Germany have all also got cases down to the 600 to 900 a day range, while the Netherlands and Belgium are around 200.
Sweden is charting its own course with more liberal policies on social interaction, and this is now clearly reflected in the pandemic's spread: it is having over 600 new cases a day, similar to much bigger countries like France, though its population of 10m is smaller than Belgium's.
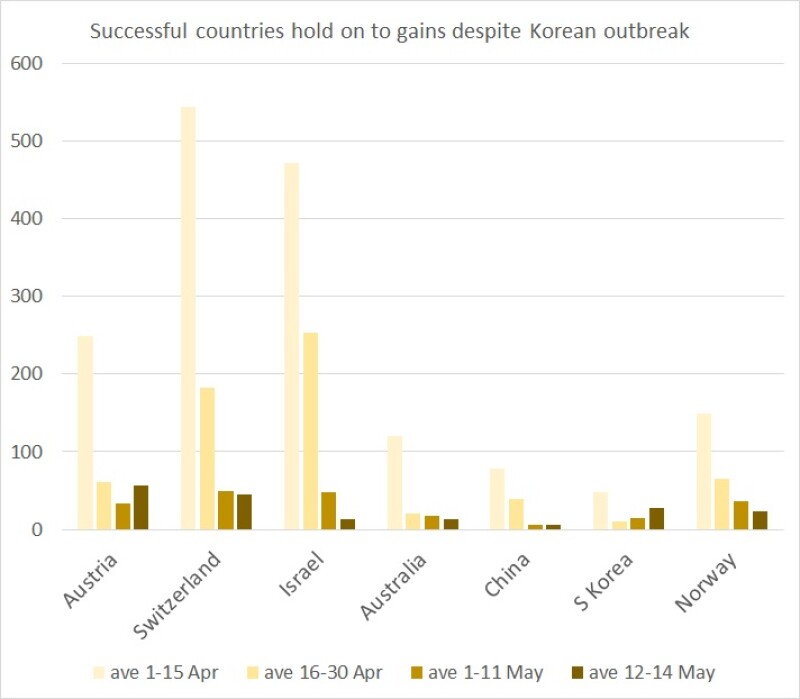
Our graphs, which show the first and second halves of April, then the first 11 days of May and the most recent three day period, show how rapidly the situation has deteriorated in Latin America.
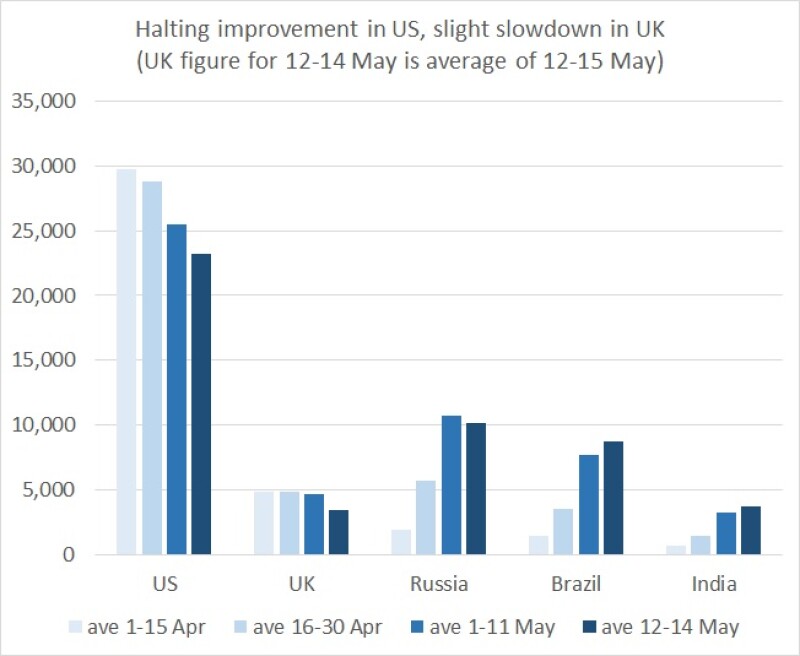
The rate of spread continues to rise in Brazil, where there were nearly 9,000 new cases a day this week, the third highest rate in the world after the US and Russia, which is at 10,000.
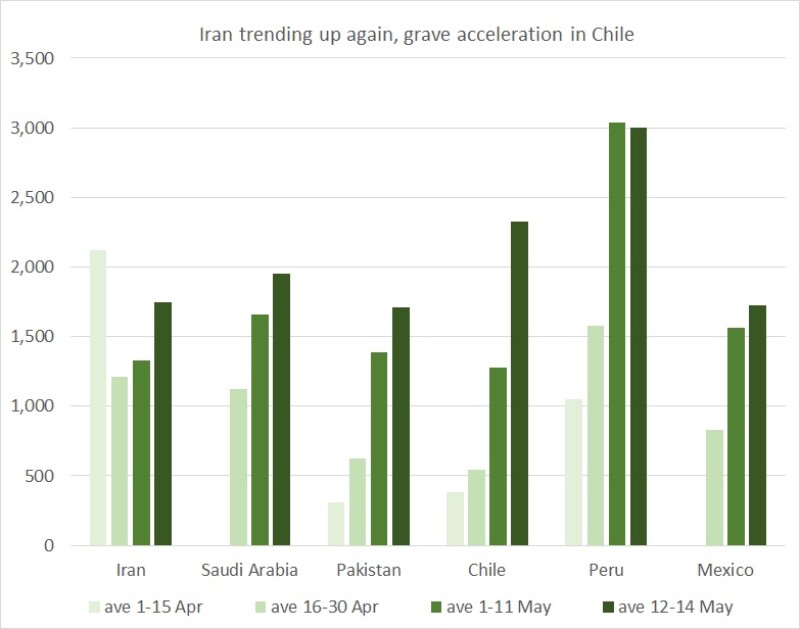
Peru is suffering around 3,000 new cases a day, and Chile has spiked severely this week, to 2,300. Mexico is over 1,500.
The last three days' average in Russia is slightly lower than the previous 11 days, but there is nothing to celebrate yet. Russia's 260,000 cases are the second most, after the US's 1.3m.
The UK has the dubious honour of third place, on 237,000. Deaths in the UK, however, at 34,000, are the second highest in the world after the US's 82,000. Of every 100,000 Americans, 25 are recorded as having died of Covid-19. In the UK, the rate is 51.
Russia has so far reported 2,400 deaths.
After Latin America and Russia, the third epicentre of Covid-19 at the moment is the Middle East. Its new caseload has hit 10,000 a day.
Iran, which had made encouraging progress, according to the reported figures, bringing new cases down from over 3,000 a day in late March to close to 1,000, has had them spike sharply again to 1,750. Saudi Arabia has topped 2,000 new cases a day and Qatar has over 1,000.
Egypt, with its huge, crowded population, is a worry: it had 400 new cases on Thursday.
There has definitely been progress in reported cases in the US, but it is far from steady. On Thursday it declared 27,000 new cases, up from 18,000 on Monday, the lowest figure since March 27. However, the three day average is still 23,000, and the columns on our graph are marching down consistently, the sign of a declining trend.
The rate is steadier in the UK at the moment: it has been between 3,000 and 4,000 for seven days. This is better than the averages close to 5,000 in April and early May, but shows little sign of dipping further.
Data updated with help from Johan Lai
Sources for national data: national health services, World Health Organisation. For regional data: WHO. WHO data can differ from national data, for example in the case of the US. However, the general trend is the same.
New confirmed daily cases
| Rationale for analysis
The coronavirus is being fought by individual countries, using their own government resources and health systems. What matters is therefore the disease's progress in each country. There is little read-across from one to another because each will have different success at controlling the disease.
The most important trend is therefore whether each country is succeeding in slowing the rate of spread of the disease. Global and regional averages are of less use, because, for example, a big decline in cases in one country could mask worsening conditions in another.
GlobalCapital has prepared these graphics, using national and World Health Organisation data. They show the number of new confirmed cases each day. We have averaged groups of days to make the trends easier to see.
The graphs cover 28 of the countries with the most cases so far. There are now cases in virtually all countries and territories.
We will update the graphics as new information emerges.
|

