Equity Implied Volatility & The Hedge Ratio
An attractive feature of the EC-Hedge (equity-credit hedge) model is its ability to use equity implied volatility as an input data. Two issuers with the same five-year credit-default swap spread will have different hedge ratios against stock, depending on their implied volatility. For a given credit-default swap spread, the hedge ratio decreases if implied volatility is higher. Indeed, a more volatile stock requires less delta to hedge changes in credit spreads. Convexity traders are more likely to make money from trading the stock in a gamma-positive strategy. Therefore, they can afford to put less money into stock to hedge the CDS.
A Standard Approach For Estimating Hedge Ratios
The results provided by the EC-Hedge model are compared to a more standard approach, in order to assess the gains provided by increasing the complexity of the model. A more simple approach relies on firm value models derived from the Merton model. Firm value models make credit spreads a function of the value of an issuer's assets and the volatility of this asset value.
* A simple and popular way for estimating the delta is based on the following process:
* Download the market capitalization of an issuer and estimates for its total debt.
* Define the asset value as the sum of debt and market capitalisation.
* Define the CDS spread as a put option on the asset value.
* Find the volatility of the asset value that prices the CDS at its market spread. This is done by using standard search algorithms.
* Use this volatility estimate as an input for deriving the delta of the CDS as a put on asset value.
By contrast to the EC-Hedge model, this approach requires no implied volatility data, but it involves debt numbers. One can translate the asset volatility estimated through the process above into a stock volatility. By no surprise, this credit-based stock volatility tends to diverge quite strongly from the real equity implied volatility.
When equity-implied volatility is higher than credit-based volatility, the firm value model produces high deltas compared to the reduced-form EC-Hedge model.
Case Studies
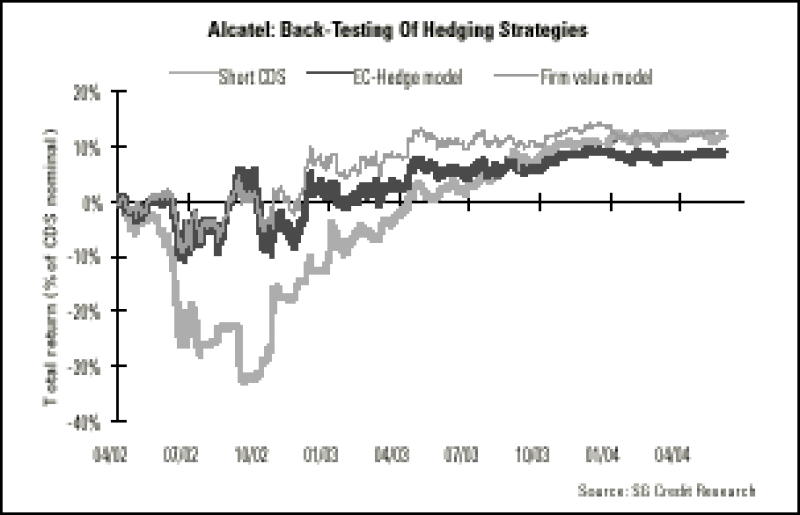
The hedging strategy provides an excellent result on an issuer such as Alcatel, whose credit spreads and stock price have been strongly correlated. The performance of a strategy based on the EC-Hedge model remains bounded within the +/- 10% area, which comes in sharp contrast to the outright CDS position. The firm model is quite successful as well, but it tends to diverge more than the EC-Hedge model from early last year. Indeed, the equity implied volatility of Alcatel was during this period quite limited compared to credit spreads. The EC-Hedge model considers this and increases the stock exposure accordingly, which proves to be the right choice for stabilising the performance of the strategy.

Back-Testing On The Euro CDS Market
The performance of the hedging strategy has been back-tested on a basket of 110 issuers on the euro CDS market over the last two years. The euro CDS market really gained in breadth over 2002 and the back-testing period contains both a strong credit crisis and a rally, so the data is relevant for analysing the hedging strategies.
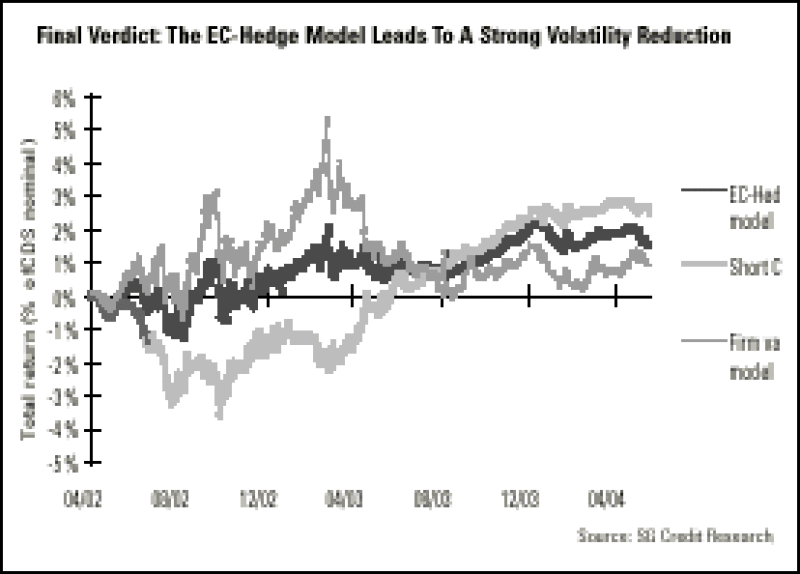
The EC-Hedge and firm value models exhibit quite different behaviours. During the 2002 crisis, the EC-Hedge model considers the high level of equity implied volatility and keeps the hedge ratios limited. This proves to be the right choice as the performance of the short stock leg mirrors quite strongly the one of the CDS position. The firm value model uses a credit-based volatility that proves to be too low as it probably leads to an excessive exposure to the stock market.

Overall, the dynamic CDS/stock strategy based on the EC-Hedge model is indeed significantly more stable than both the directional CDS portfolio and the strategy based on the firm value model.
The events at the beginning of the 2002 crisis and the trend over 2003, however, need to be discussed at this point.
When credit spreads widened in the middle of 2002, they did so more sharply than stock prices decreased. As a result, the hedging strategy still loses 1%, compared to over 3% on the CDS side. Only over the following quarter, with the September 2001 crisis, did equities fall to the point that the short stock position finally offset losses on the credit side. This is a recurrent pattern during a credit crisis, as credit spreads tend to follow less continuous paths than equity prices.
Since early last year, the strategy based on the EC-Hedge model has been less volatile than the firm value model. It is, however, biased toward a positive performance. This comes as no surprise: whereas stock indices still lag their levels from early 2002, credit spreads have been reduced strongly over the period. A CDS is an equity option only in theory. In real life, changes in relative value between both markets have a direct impact on the performance of equity-credit strategies. In our view, this is the main meaning of the fluctuations observed in our back-testing study.
* This suggests two improvements to the hedging strategy:
* Hedge CDS with equity options as well. During a credit crisis, equity implied volatility tends to move as sharply as credit spreads do and a hedging portfolio including both equities and options is likely to hedge CDS risks better at the beginning of a credit crisis.
* Try to adjust hedge ratios based on expectations on future market trends on credit and equity markets.
* These changes in relative value, on the aggregated as well as on the individual level, may be a trading opportunity. The hedging strategy tends to be strongly mean-reverting and our results so far show the EC-Hedge model can provide efficient hedge ratios for such relative value trades.
Conclusion
Our study shows equities can help decrease sharply the volatility of a CDS portfolio. Hedged positions are still exposed to a potential loss risk in case of a credit crisis and a possible divergence between trends on both markets. But hedging strategies help to stabilise performance and keep it bounded within a reasonable range. As a result, equities appear as an efficient hedge for credit and our results may even be improved further by incorporating equity options within the hedge.
Compared to a standard firm value model, the reduced-form model we have tested here brings a significant improvement to the efficiency of hedge ratios. A key point here is its ability to take profit from information brought by equity options. The EC-Hedge model tends to generate lower hedge ratios than the firm value approach, at least when equity implied volatility is high against credit spreads. A more volatile stock requires less hedging and this proves to be the right choice for stabilising performance--as was especially the case over the 2002 credit crisis.
In our quest for the optimum hedge ratio, the EC-Hedge model provides--if not the holly grail--at least a complete and efficient estimation of equity hedge ratios.
This week's Learning Curve was written by Julien Turc, strategist in the quantitative credit strategy group at Société Générale in Paris.


