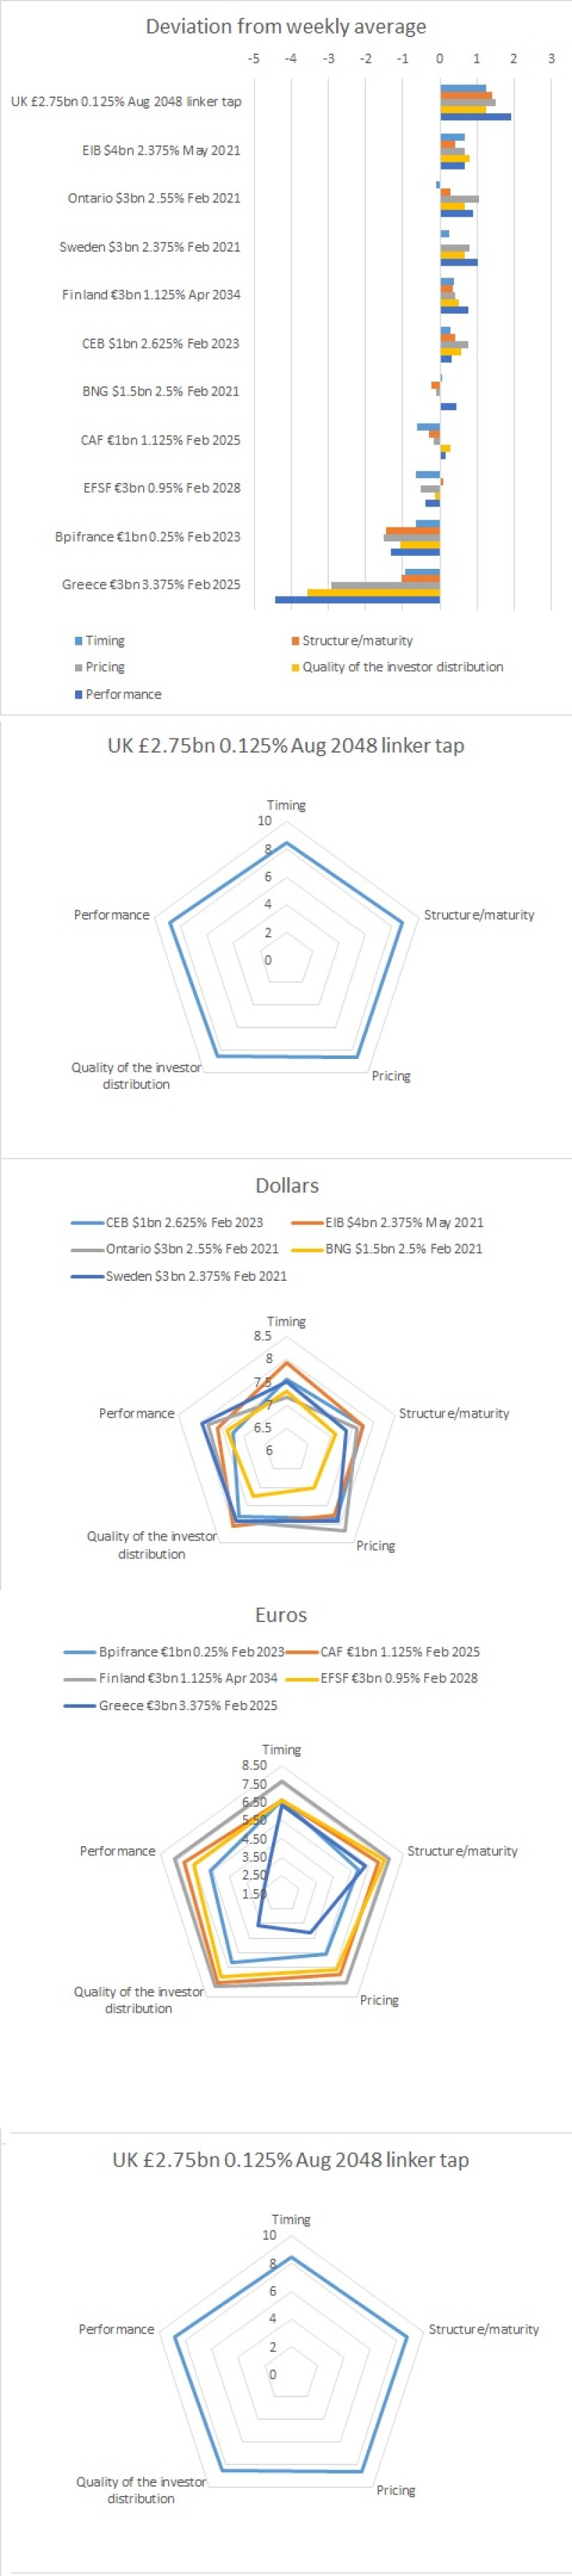
There was strong volatility during that week and that was perhaps reflected in what was a much wider spread of average BondMarker scores across the five deal categories available for voting (pricing, timing, structure/maturity, quality of the investor distribution and performance) than during the benign conditions earlier in the year.
Topping the bill with an average of 8.64 was the UK — a perennial strong performer — with a £2.75bn tap of its August 2048 linker. Bank of America Merrill Lynch, JP Morgan, Lloyds Bank and Santander were leads.
At the other end of the scale was Greece’s €3bn February 2025 — run by Barclays, BNP Paribas, Citi, JP Morgan and Nomura — that scored an average of just 4.60. Its score was weighed down by a low 2.50 for performance.
Seven trades scored an average score in the 7.0s — EIB’s $4bn May 2021 (7.82), Ontario’s $3bn February 2021 (7.74), Sweden’s $3bn February 2021 (7.73), Finland’s €3bn April 2034 (7.66), CEB’s $1bn February 2023 (7.64), BNG’s $1.5bn February 2021 (7.21) and CAF’s €1bn February 2025 (7.05).
EFSF’s €3bn February 2028 came in just below that with an average score of 6.86 and Bpifrance’s €1bn February 2023 scored 5.98. Both trades, like Greece, had fairly low scores for performance — 6.55 and 5.63, respectively.