As the credit-default swap market matures, more and more names trade with significant liquidity across the entire range of tenors away from the traditional five-year point. In this article we derive an exact formula for forward CDS spreads in terms of spot CDS spread term structure and corresponding risky PV01s and explain their usage as a consistent relative value measure for curve trading strategies.
Forward CDS Contracts Vs. Forward CDS Trades
A forward CDS contract corresponds to buying or selling credit protection that is active for a period of time in the future at a premium which is preset today, but payable only during that future period. For example, a five-year CDS two years forward (i.e. 2x5 forward CDS) refers to protection which starts in year two and continues for five years afterward, ending in year seven from today, with premiums paid quarterly during that period. Importantly, the forward CDS knocks out and provides no protection if a credit event occurs prior to the forward start date.
| 2x5 Forward CDS vs. 2s-7s CDS Steepener | |||||||
| Maturity (years) | 1 | 2 | 3 | 4 | 5 | 6 | 7 |
| 2x5 Forward CDS | |||||||
| Premium paid | 0 | 0 | 41 | 41 | 41 | 41 | 41 |
| 2s-7s Steepener Pair | |||||||
| Sell 2-year protection | 22 | 22 | |||||
| Buy 7-year protection | 35 | 35 | 35 | 35 | 35 | 35 | 35 |
| Net premium paid | 13 | 13 | 35 | 35 | 35 | 35 | 35 |
| Hedged forward CDS | |||||||
| Net premium paid | -13 | -13 | 6 | 6 | 6 | 6 | 6 |
While the market participants rarely trade such a contract, they often trade long-short pairs of spot CDS which are almost--but not exactly--identical to a forward CDS. These pair trades are known in the market as CDS steepeners and flatteners. For example, buying a 2x5 forward CDS protection is similar to a 2s-7s curve steepener trade whereby one sells protection to two-year maturity and buys equal notional protection to seven-year maturity. This trade would outperform if the spread curve steepens, hence the name steepener. In terms of the protection payment leg such a trade is indeed equivalent to a forward CDS--if the credit event occurs before year two the long and the short protection payments will cancel each other, while if the credit event occurs between year two and year seven only the long protection leg is active and it will provide the same protection payment as the forward CDS contract.
The premium legs are somewhat different between the forward CDS and the long-short pair trade. The table demonstrates the premium cash flows for each of the trades. As we can see, the steepener pair trade has premium payments during the first two years, while the forward CDS does not. Conversely, the net premium paid on a steepener trade between years two and seven is somewhat lower than the forward CDS premium in this example.
The easiest way to analyze the relationship between the premium legs of the forward CDS and the long-short pair trades is to consider a hypothetical example of a hedged forward CDS trade. Such a trade consists of a long protection position via forward CDS combined with a short protection via 2s-7s CDS flattener. The 2s-7s flattener trade is equivalent to a short position in the 2s-7s steepener, with the two sides of the pair trade reversed, i.e. buying two-year and selling seven-year protection. In the table we show the net premiums paid on such a hedged forward CDS trade, using AXA senior CDS as an example, which at the time of writing of this paper traded at 22 basis points for two-year protection (risky PV01 = 1.9 yrs) and at 35bps for seven-year protection (risky PV01 = 5.8 yrs).
Since the forward CDS hedged by a long-short CDS pair provides no protection payment under any default scenario, the present value of the protection leg of such a trade is identically zero. Therefore, we must require that the net premium cash flows of a hedged forward CDS trade also have zero present value. The present value of each basis point paid from today until the earlier of a given maturity or the occurrence of the credit event is given by what is known as risky PV01. Hence, this requirement can be written as:
[1]
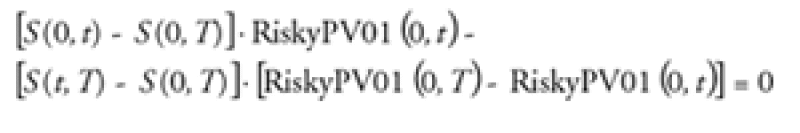
Here, S(0,t) is the spot CDS spread for the starting date, S(0,T) is the spot CDS spread for the ending date, and S(t,T) is the forward CDS spread for the given interval of maturities. Risky PV01(0,t) and Risky PV01(0,T) are the risky PV01s for the starting and ending dates, respectively. The first term represents the present value of the stream of cash flows between today and the starting date and the second term corresponds to the present value of cash flows between the starting and ending dates.
From this condition we obtain the following simple relationship for forward CDS spreads:
[2]
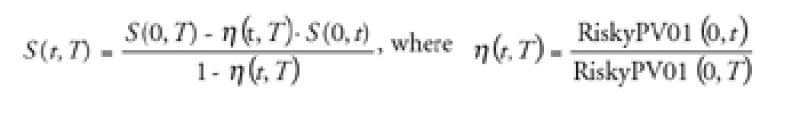
Thus, the forward CDS spread is equal to a weighted average of the spot CDS spreads to initial and final maturity, with the weights determined by the ratio of risky PV01s to each maturity *(t,T). To calculate the values of risky PV01s, one can use the standard pricing methodology, which is implemented on the Bloomberg CDSW page.
Curve Trading Strategies
The forward CDS spreads derived in this fashion can be compared with the spot CDS spreads of similar horizon and, depending on the issuer and market credit outlook, can serve as an indicator of relative value for either long or short forward trades in CDS. Below we give examples of hypothetical curve trading strategies:
*Long-term bullish view in a steep CDS curve: Sell five-year protection starting five years forward (5x5 forward CDS), to maximize the spread pickup over the spot CDS curve. According to equation [2], the 5x5 forward CDS spread will be much wider than the spot five-year CDS spread. Alternatively, this view can be implemented by executing a 5s-10s CDS flattener trade, i.e. buying five-year spot protection and selling 10-year spot protection.
* Intermediate-term bearish view in an inverted CDS curve: Buy three-year protection starting two years forward (2x3 forward CDS). According to equation [2] the 2x3 forward CDS spread will be tighter than the three-year spot CDS spread. Alternatively, one can execute a 2s-5s steepener trade by selling two-year spot protection and buying five-year spot protection.
As we can see, trade directions using forward CDS metric are quite intuitive--flattener and steepener trades correspond to buying the widest spread or shorting the tightest spread, respectively. Of course, more elaborate strategies, including barbells and duration-neutral pair trades, can also be constructed and tailored to investors' credit outlook, especially if this outlook has a particular time frame.
In many instances, investors have traded CDS curves not because of a specific time frame around the credit outlook or a view about the forward CDS spreads, but simply as a way to get net long or short position in a given issuer while tying down only a fraction of the current cash flows. This is particularly important for a short position, i.e. the steepener trade. For example, a 5s-10s steepener trade has net negative spread duration which is approximately 2/3 of that of a five-year spot CDS, while the net current premium payments are often a much smaller fraction of the five-year premium, unless the curve is already very steep. If the investor's horizon is extremely short, the trade may actually perform and be unwound much earlier than the high future premium payments come into effect.
Of course, this amounts to an implicit increase in the leverage of the trade, which can be defined as the amount of mark-to-market risk per unit of current premium payment. Like most long-short or forward trades, the steepeners and flatteners can be and frequently are used for their leverage effect in conjunction with a directional view of the underlying market, rather than because of the specific level of the forward value of the underlying which is encoded in them. In the case of popular Dow Jones CDX portfolio default swaps, the leverage incentive is even more important because these products trade with fixed contract spread and variable up-front payment depending on the current portfolio spread. Netting of these up-front payments for CDX curve trades leads to a substantial decrease of capital commitment and consequently to an increase in expected return on capital. Investors should be aware of this and should carefully differentiate the reasons for entering into curve trades in CDS.
This week's Learning Curve was written by Arthur Berd, senior v.p., and Elena Ranguelova, v.p., in the credit strategies group at Lehman Brothers in New York.
References
Berd, A. (2003): "Forward CDS Spreads", Quantitative Credit Research Quarterly, vol. 2003-Q3, Lehman Brothers Fixed Income Research.
McAdie, R., M. Bhimalingam and S. Sen (2003): "Forward CDS Trades", European Credit Strategies, Lehman Brothers Fixed Income Research, November 5, 2003.
E. Ranguelova (2004): "CDS Steepeners", Structured Credit Strategies, Lehman Brothers Fixed Income Research, April 7, 2004.