Since the beginnings of the collateralized debt obligation market, there has been intense interest in ensuring bespoke CDO positions are correctly marked to market. As with any new product, when traders start making booking revenue, control and risk management departments are never slow to challenge traders to prove profit and loss is real and hedging strategies actually work. With the advent of the broker-traded index tranche markets, however, the opportunity now exists for investors to calibrate models using readily observable and relatively liquid instruments.
The Inadequacies Of Current CDO Models
In an ideal world, traders' models would fit all pricing data without any need for interpolation and extrapolation schemes or the estimation of parameters which, while accounting for observed prices, may appear to admit arbitrage or at least suggest contradictions in the assumptions being made for apparently similar structures. For example, if the large homogenous portfolio model (LHP), used more or less as a standard to back out base correlations on index tranches, were a perfect model of the behaviour of the index portfolios, then there would be no correlation skew and the market ought to trade at levels comparable to historically observed correlation.
Of course, the LHP model is an oversimplification of the pricing problem at hand: it assumes all the spreads in the portfolio are the same, the correlation of all entities to the market is the same, one factor drives the loss distribution and the driving factor can be captured from observations of equity prices. Because this is not the case, in order to mark a varied book to market using a simple model, we have to resort to heuristics to estimate appropriate model inputs.
At the moment, this is probably true even for those dealers with far more sophisticated models than LHP. Although the best models may explain much of the skew, it is unlikely that they explain it all, taken across portfolios with different credit and/or regional mixes. So, to some degree, model misfit must either be accepted, or explained by parameterizing the model inputs as a function of the portfolio characteristics.
Determinants Of Correlation Skew
Over recent months, a typical picture of correlation skew has been upward sloping when plotted against tranche detachment points. Comparing the iTraxx Europe correlation skew with CDX.NA.IG, at first sight it appears the iTraxx base correlation curve lies well above that for CDX. The spread of the CDX, however, is about 1.5 times that of the iTraxx, and when we express the detachment point not as an absolute amount but as a multiple of the expected loss of its underlying portfolio, the curves come closer into line.
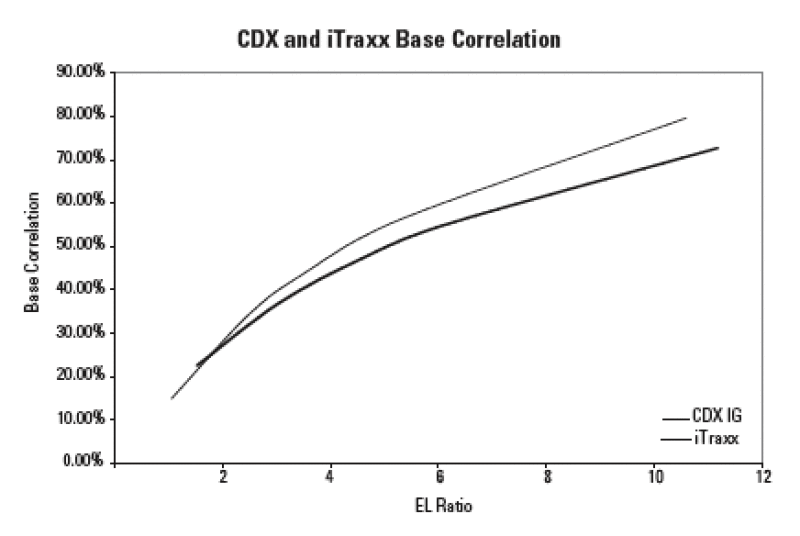
If we attempt the same trick to compare CDX.NA.IG with CDX.NA.HY, there is no such correspondence--indeed, the base correlation curve for HY displays positive rather than negative convexity, and far higher correlation for a given expected loss.
Equally, if we try to line up tranche pricing for iTraxx CJ against iTraxx Europe, we find fundamentally a different shape of base correlation curve around the equity tranche in particular.
So, what is going on here? We have a suggestion that for similar portfolios (iTraxx Europe and CDX.NA.IG are both investment grade) probably all we need to do is to normalize for the tranche structure as a multiple of expected loss--but where either the expected loss is massively different, or there are country-specific risks at play, we need to model these too.
Adjusting For Historic Correlation Differences
From this position, we might feel quite confident in our ability to price portfolios similar to the iTraxx Europe and CDX.NA.IG indices. But we are still not quite there--how do we account for those portfolios which are either more concentrated or more diverse than the indices? One suggestion is to take historic correlation into account. If we use a power transformation
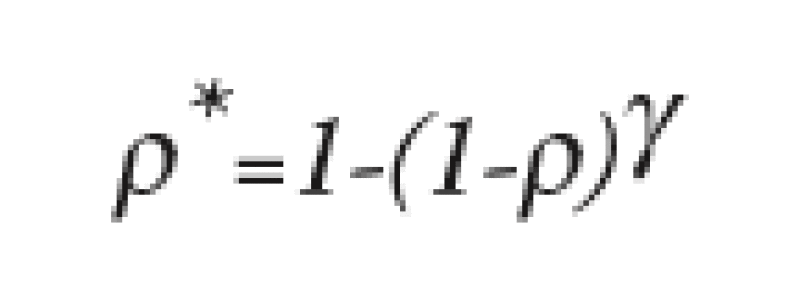
where
*(d) = u + vd, u and v are constants, * is the historic (spread) correlation of the portfolio and d is the detachment point of each tranche divided by the expected loss of the portfolio.
Then, we have, in some sense, modelled the basis between historic and base correlation. We can then take a bespoke but sufficiently similar portfolio and apply the same transformation to the historic correlation to get a value to use for base correlation of any tranche of the bespoke portfolio.
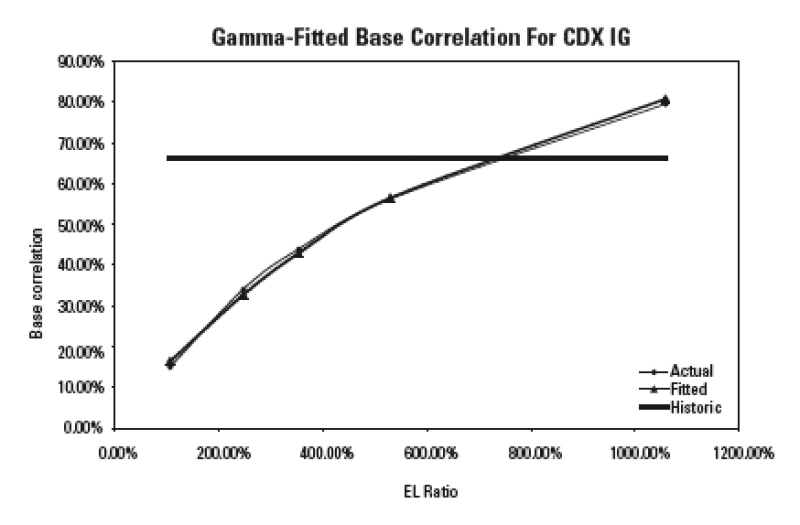
(Note that the requirement to have * as a linear function of d is not strict--where the model fits well, as the graph below for CDX.NA.IG shows, this is fine, but in other cases, such as CDX.NA.HY, an alternative functional form can be used. I would also add that the description above does not accurately represent our full approach to modelling bespoke CDOs--the principle is the same, but the pricing model we use is richer than LHP, as is the functional form for the correlation transformation)
And Finally?
Finally, what about dissimilar portfolios which don't look like European or North American investment grade? For those unable to participate in regular consensus pricing exercises, it is not wise to extrapolate all portfolios from the investment grade index tranche market. For now, pricing these remains subject to some uncertainty until a wider variety of tranche data is readily available--but knowing the ever-changing credit markets, this will not be long in coming.
This Learning Curve was written by Tom McNerney, managing director and head of analytics at Markit Group.