In our last Learning Curve (DW, 8/8) we introduced a local correlation model that makes correlation a function of the economy. Under the large pool assumption we presented the so-called market law of losses that relates portfolio losses to the base correlation smile. In this piece we will present a process for fitting the local correlation curve directly to market data, and compare it to the market practice for pricing and hedging CDO.
Beyond The Large Pool Assumption
Our study under the large pool assumption has proven consistent with the market-observed compound correlations, thus providing an idea of the shape of the local correlation. It seems to us the finite size of the portfolio and the dispersion effect introduced by the heterogeneousness of the entities do not create a major change in the structure of the local correlation.
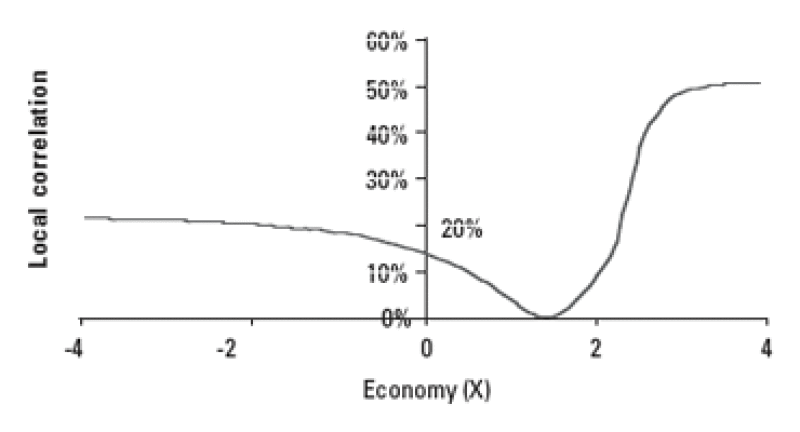
For using the model in practice, we propose to specify a shape for the local correlation and calibrate it to the market's standard tranche spreads. Finding a correct specification for the local correlation function is far from obvious, however. Local correlation is a function of the risk factor within the model, a factor that is interpreted as the state of the economy. It is at first sight difficult to interpret this variable from the standpoint of a trader or of a portfolio manager. This is why we use a mapping of the economy into a strike in the fitting process.
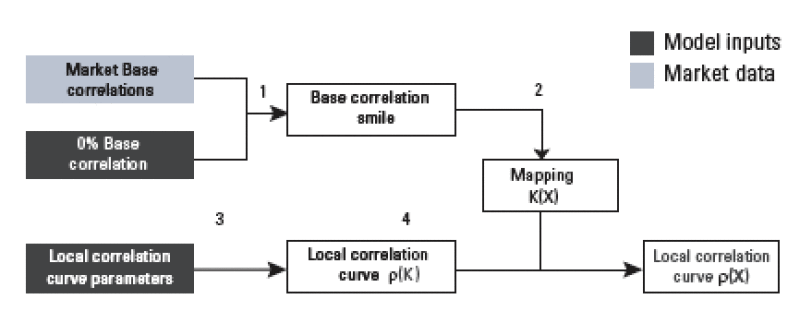
The process for fitting the local correlation curve can be divided into four steps:
1. Extrapolating The Base Correlation Smile

The market for standard tranches provides five different quotes and therefore five data points in the base correlation smile. The whole correlation smile (for strikes ranging from 0% to 100%) is necessary to determine the mapping of the economy into a strike. It is therefore necessary to interpolate and extrapolate the existing data points. The extrapolation of the 0% base correlation has a crucial impact on the mapping of the economy into a strike.
2. Mapping The Economy Into A Strike
In the large pool framework there is a simple formula that links the distribution of portfolio losses and the base correlation smile. From this so-called market law of losses, we derived a mapping such that for each strike K, there is only one economy X(K) that gives a portfolio loss equal to K.
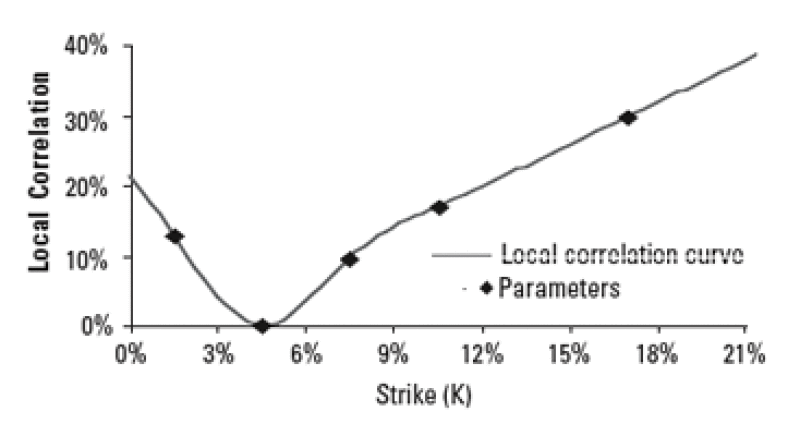
3. Parameterizing the local correlation curve as a function of strikes

We chose to parameterize the local correlation curve as a function of the strike since it is much easier to interpret the curve and to assess the accuracy of the resulting parameters by comparing them to the market implied compound correlations.
4. Computing the local correlation curve as a function of the economy
Once the local correlation curve is determined as a function of the strike, it is easy to transform it into a function of the economy using the mapping K(X).

Pricing With Local Correlation
Pricing CDOs with non-standard strikes
The base correlations for a non-standard threshold are typically defined as a linear interpolation of liquid base correlations. For instance, the base correlation for 4% and 7% attachment points are estimated as a weighted average of respectively 3-6% and 6-9% base correlations. A 4-7% mezzanine tranche is then priced using these parameters.
Pricing CDOs for different baskets
If the underlying portfolio is not one of the few indices traded on the correlation market, it becomes more difficult to estimate the correlation of the CDO. Traders typically use tranched iTraxx correlations with similar subordinations. Correlations on indices are normalized against the expected loss of the underlying portfolio. As a result, the base correlation used to price a 6-9% equity tranche is higher for a portfolio whose average spread is below the spread of the index, given that its implied subordination is better.
Pricing CDO Squareds
In theory, CDO squareds should be based on a full simulation of all potential outcomes on all inner CDOs. This cannot be done under the traditional Gaussian copula model, for the model itself is not flexible enough to fit to spreads of all inner CDOs. By contrast, the local correlation model is well suited to pricing CDO squared in a way that is consistent with the quoted prices in the correlation market.
Pricing Exotic Products With Local Correlation
Local correlation as a constant across different portfolios
Pricing non-standard products with local correlation is very simple. Once the local correlation function is estimated on index tranches, one can apply this structure to bespoke CDOs using the mapping of the state-of-the-economy factor into a strike.
There has been some debate on how base correlation should be adjusted from an index into a portfolio with a higher spread. Within our framework, it is more natural to analyze the impact of a change in portfolio on the marginal compound correlation. The transformation writes:

where *M is the marginal correlation function. This relationship helps us understand how the local correlation model adjusts for the change in the underlying portfolio. The relationship, however, is true only within the large pool framework, for European CDOs and with the assumption that the asset value is Gaussian.
A new definition of tranche subordination
Whereas traders usually define subordination as an adjustment of the strike according to the expected loss of the portfolio, the local correlation model directly characterizes the subordination using the cumulative loss function (L). Identical correlations are given to strikes which have the same probability to be exceeded by the global loss of the portfolio. In the table below we give a list of the prices of different baskets with different portfolios using the base and the local correlation method. All the spreads from the index (with an average premium of 40 basis points) have been shifted to give the portfolios more or less risk.
The dynamics of subordination are less pronounced with the local correlation curve as it takes into account the convexity of the loss function.
| Comparison of both methods for different portfolios | ||
| Portfolio premium | Base correlation approach | Local correlation approach |
| 20bp | 40bp | 54bp |
| 30bp | 82bp | 91bp |
| 40bp | 149bp | 149bp |
| 50bp | 260bp | 230bp |
| Source: SG Credit Research |
Hedging With Local Correlation
The correlation smile should have an impact on hedge ratios. A rise in spread is to some extent akin to a loss in subordination, so that a mezzanine tranche 'rolls down' on the smile when spreads increase. If the CDO is senior enough, this roll-down effect leads to a decrease in compound correlation, and therefore an appreciation in the marked-to-market of the product. This mitigates the negative effect of the spread increase, and decreases the amount of CDS required to delta-hedge the trade.
Conclusion
The local correlation model provides a coherent framework for pricing various tranches on a given portfolio. We exhibit a rule for switching from index into bespoke correlation: give the same (local) correlation to strikes that have the same risk of being hit.
If the local correlation model fits perfectly well to market data and provides an attractive framework for pricing second generation products, the empirical correlation between credit spreads and compound correlations is a challenge to any modeling attempt. Therefore it is not necessarily the best framework to use in order to build a hedging strategy for CDOs.
This week's Learning Curve was written by Julien Turc, Philippe Very, Devid Benhamouand Benjamin Herzog, quantitative credit strategy officials at SG Corporate & Investment Banking in Paris.


