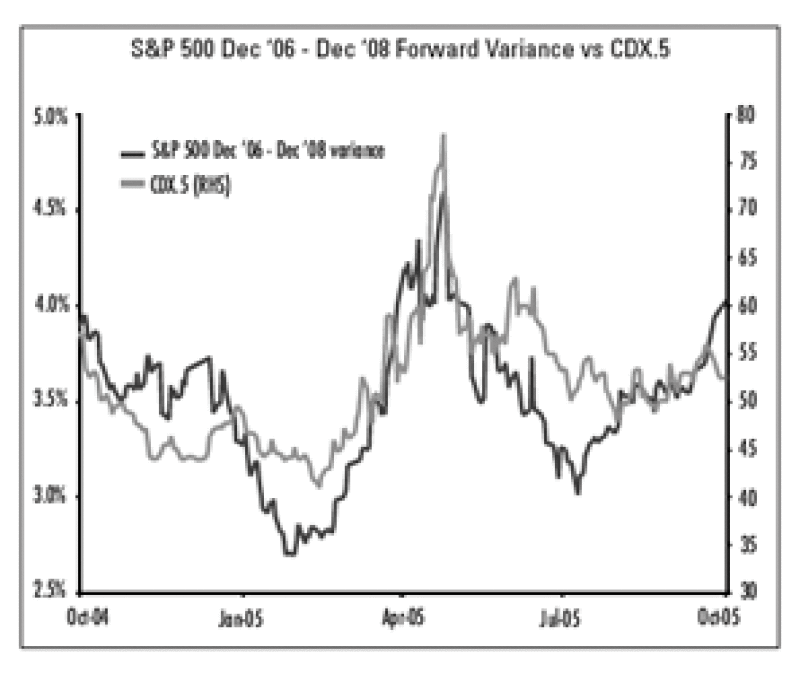
There has been a dramatic increase in the liquidity of index credit and equity volatility products over the past two years. Given the strong correlation between these two markets, we explore relative value opportunities between credit indices and variance swaps on equity indices and discuss why we feel variance swaps can offer some advantages over vanilla puts in this context. Following on, we present a simple strategy using these products that has yielded attractive results. Accordingly, we suggest investors monitor this relationship to identify entry points for convergence trades or use variance swaps to hedge credit portfolios.
Introduction

Investors have traded equity versus credit in single names for some time. Developing trades generally involves using a variant of the Merton model to identify mispricing across the capital structure of individual firms. We are seeing growing interest in executing some of the same strategies at the index level. Both credit indices (ie, the CDX and iTraxx) and equity volatility (i.e. variance swaps on equity indices) have become significantly more liquid over the past few years. Most market participants acknowledge that credit spreads and volatility are correlated. It is challenging, however, to construct a structural model to identify opportunities because the underlying assets are diversified portfolios rather than individual firms.
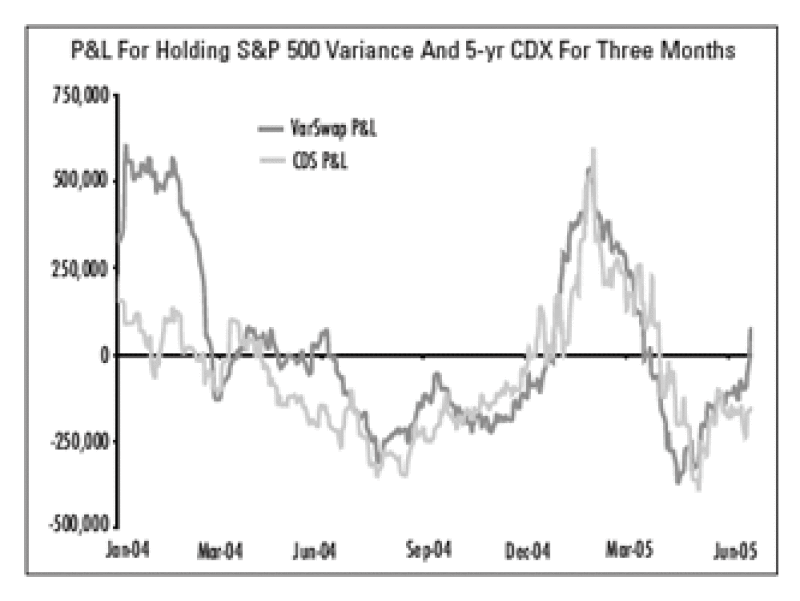
Instead, we examine these trades using a statistical approach. We compare the profit and loss from going long variance to the P&L from going long credit protection over short holding periods over the past 1.5 years. The returns from the two strategies are highly correlated. Moreover, we develop a simple model to identify times when the two markets appear mispriced relative to each other. We compute the P&L from executing credit versus equity variance trades at those times. The strategy has performed well, identifying profitable opportunities 66% of the time (on U.S. indices).
Our results indicate that there is a fundamental, tradable relationship between these two markets. Investors can exploit this in at least two ways. First, investors can directly trade the relative value between credit and variance. Second, investors can use a long equity variance as a way of going short credit. Understanding the relationship between the two markets will help us identify when these strategies are attractive.
Setting Up The Trade
First, we specify the instruments we would like to trade. On the equity side, we prefer to use Dec. '06Dec. '08 forward index variance. In general, we feel that variance positions (especially forward variance) offer advantages over vanilla options. First, vanilla options would generally be delta hedged, thus requiring investors to dynamically hedge their positions. Second, near-term events (eg, realized volatility) directly impact vanilla option positions. Given that we are looking to trade this strategy on a statistical basis, we prefer an instrument that is more commodity-like in nature. Indeed, we want the P&L not to be directly impacted by near-term realized volatility, but more by supply and demand.
We choose forward variance as it is still very liquid and trades more like a commodity than spot variance. Indeed, forward variance swaps provide a clean exposure to future volatility without being directly impacted by realized volatility in the interim. As a result, the P&L of a forward variance swap is driven solely by supply and demand, whereas the P&L of a spot position is impacted by realized volatility. We chose the Dec '06Dec '08 window as this has regularly been quoted and already been commoditized to some extent.
For credit, we use the spot markets--specifically, the on-the-run versions of the five-year CDX and iTraxx indices. Forward credit is difficult to trade because other maturities are significantly less liquid. Further, the analogous concept to realized volatility is realized defaults. Although a forward credit position would insulate the trade from losses due to actual defaults, these are rare in investment-grade indices. Since we roll into the on-the-run version of the index every six months, the credit quality of the index remains high (names downgraded below investment grade are removed from the new versions of the indices). As long as no actual losses occur, the performance of a five-year credit index reflects the market's perception of future risks, as does forward equity variance.

Next, we determine the relative notionals to trade on each leg. Given that we are not using a structural model, it is not immediately obvious how to quantify the relative notionals. Here we offer a straightforward approach based on equating the maximum downside in each leg. Specifically, we align the notionals of the variance swap and credit index such that the maximum losses from going long variance are equal to the maximum losses from going long index credit protection. The maximum loss is computed assuming the underlying levels (of both variance and credit spreads) instantaneously go to zero. While credit investors generally focus on stressing spreads under the opposite scenario (e.g. jump to default), we are implicitly assuming that by matching the credit and variance movements in this direction, they should move similarly in the other direction. It appears that our methodology work well in practice. Indeed, the P&Ls generated in our backtests of both the credit and variance legs are generally similar in magnitude.
Another natural approach would involve a statistical beta between the two assets. We analyzed this, among other alternative methodologies, in order to determine the hedge ratio and it produced very similar results. Consequently, we gain comfort from using the above methodology and expect that any further fine-tuning of the hedge ratio would likely be done from a fundamental perspective.
A Statistical Model
Following our premise that a statistical model is better suited for this application, we have implemented a straightforward z-score model based on relative index credit and variance levels. We perform a rolling regression (over three months of data) which estimates variance levels as a (linear) function of index credit levels. We then compare this to the current level of variance swaps in the market, normalized by the regression's standard error, to produce a z-score metric indicating the relative richness or cheapness of variance to credit (NB: a higher z-score indicates variance is rich relative to credit, a lower z-score indicates the opposite).

Once we have the daily z-score, we compare it to the subsequent performance of a relative value trade which is short variance (100K vega) and long credit protection (corresponding notional as specified above), held for three months. Accordingly, we would hope for positive (negative) z-scores to correspond to positive (negative) P&Ls.
We have done our best to compute precise P&Ls. In particular, we use bid-ask spreads of +/-30 bp on the variance products and +/-0.5 bp on the CDS indices. Moreover, we calculate precise P&Ls on the credit side by computing both the mark-to-market and the carry of the trade.
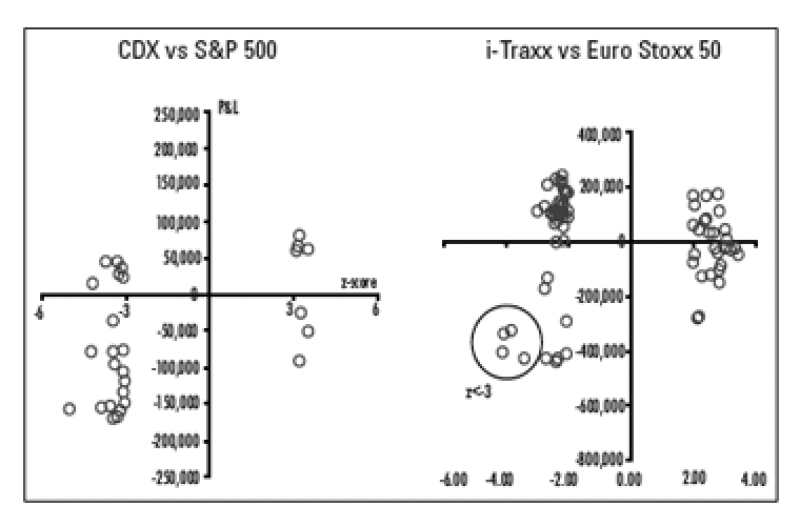
These results appear encouraging in the U.S. (S&P 500 variance vs CDX). In our backtest over the last year and a half (using lzl>2 as a cut-off to flag opportunities), our regression model was able to identify profitable trades 66% of the time (20 out of 29 trades) with an average profit of USD66,000 (recall that each trade was setup with USD100,000 of vega and the notional on the credit index side was determined as specified above). Drilling down, the model correctly identified 73% (16 out of 22) profitable opportunities to buy variance and sell credit with an average profit of USD82,500 and 57% (4 out of 7) profitable opportunities to buy credit and sell variance with an average profit of USD13,400.
On the other hand, the results do not look very promising in Europe (Euro STOXX 50 variance vs i-TRAXX). Just less than half of the flagged trades were profitable making for an average loss of -14,000 per trade. We suspect this may be due to a larger degree of basis risk between the underlyings of the credit and equity indices here.
Worth noting, however, is that the long variance/short credit protection trades flagged using a higher cutoff (lzl>3) were very profitable, a similar trend we saw in the U.S. based trade. Indeed, these trades averaged ¤376,000 profit per trade.
So what relative value does the model indicate today? Using our z-score approach above, we calculate a z-score of 1.65 for the S&P 500 Dec '06 Dec '08 variance vs 5 yr CDX index. This indicates that the credit is slightly cheap relative to the variance but not enough for us to suggest a relative value trade. We obtain a z-score of 0.50 for the Euro STOXX 50 vs 5 yr i-TRAXX index. This indicates that the variance essentially looks fairly valued.
Comments
We have seen a trend towards shareholder-friendly activities by corporates in recent years. Investors have amassed massive pools of equity capital and lenders look poised to provide further debt financing. Accordingly, we suggest investors pay careful attention to companies' shareholder-friendly biases and M&A/LBO appetite. While volatility and credit spreads should be impacted by this sort of activity, the impact on future equity index volatility is mitigated by two factors. First, the equity index rebalance mechanism will drop privatized companies from the index. And second, the resultant realized volatility would likely be viewed as temporary and have minimal impact on future index volatility. On the other hand, index credit protection does not benefit from the same sort of rebalance mechanism. Thus, in the context of this strategy, we are biased to favor short volatility, long credit protection strategies from a fundamental perspective.
This week's Learning Curve was written by Jeff Meli, Aaron Brask, Lorenzo Islaand Thibault Scaramanga, strategists at Barclays Capital.


