Multi-asset class exotic business is highly dependent on Monte Carlo. In this article, we shall show a simple but powerful idea on the numerical side of Monte Carlo. We shall show how to extract the important Greeks, delta, gamma matrix in an efficient, accurate, fast, and robust way.
In practice, pricing of multi-asset exotics is a building block that feeds the risk engine. Indeed, the risk engine calls the pricing functions as many times as necessary in order to compute all the following quantities:

In this set up, the first mistake was to bump the spot and use a new set of random numbers. This created extra noise in the pricing which was differentiated and then amplified. The Greeks produced by this method were therefore highly inaccurate and meaningless. Common sense corrected this mistake by providing pricing functions with one new input which is the seed that serves the creation of the random numbers. Although this process is better, it can be shown that the obtained numbers were biased especially with discontinuous payoffs such as barriers and digitals. The academic community then offered one of the most powerful tools for calculating the Greeks, the Malliavin calculus. This technique, however, has several drawbacks. It is model dependent and must be carefully implemented as a local method especially if there are close fixings. Robustness is a problem.
We propose in this article a different approach, which is actually common in statistics: regression methods. We benefit from the American Monte Carlo experience.
Indeed, for any payoff we simulate the process at an extra date, a date from which we will project our payoff on the set of basis functions.

The projection is done by the robust routine Singular Value Decomposition (SVD). We obtain the following pricing function representation:

What we obtain is a local description of the pricing function that will serve the purpose of the Greeks calculation. Using the model knowledge we can write:

Therefore we have a local description of the pricing function:

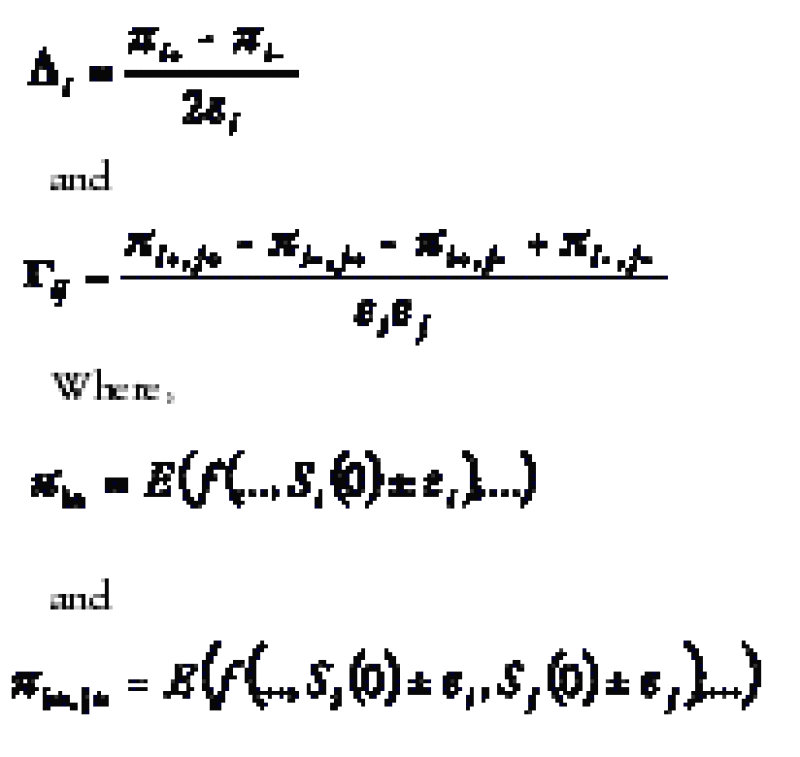
Therefore the Greeks can be easily calculated the following way:

Adjustment To The method
The Greeks calculated by this method are the internal Greeks of the model. Practitioners like to perturb the model using a set of predetermined scenarios which is not inline with the internal modes of the model. We can easily overcome this difficulty by correcting the Greeks with a term of the form:

Examples
Let's show how this method applies first to the simplest of products, a call at the money, with maturity one year and using the Black Scholes model with no drift and a volatility of 20%. We show in the following table the representation of the value function using the regression versus the real pricing Black Scholes formula. As you can see the representation is extremely good around today's spot 100.The second example explores a popular product, which is the Asian call with a daily averaging. Using only 10,000 simulations, the Monte Carlo gamma is equal to 0.0176% whereas the analytical gamma is equal to 0.0173%.
The third example concerns a multi-asset product and simply a basket option on two underlyings. We obtain again using only 10,000 simulations good results for the estimation of the Greeks:
| Greek | Regression | Theoretical |
| G11 | 0.0000623 | 0.0000632 |
| G12 | 0.0000609 | 6.32E-05 |
| G22 | 0.000248 | 2.40E-04 |
The fourth example concerns a discontinuous payoff. It is a digital option with a maturity of one year. We extend the basis functions to include a third degree polynomial. Using only 10,000 simulations we show in the following graph how the value function compares with the real pricing function.

The calculated gamma using the regression gives -1.23e-04 whereas the theoretical gamma is equal to -9.92e-05.
The next example is the same as the previous one with a different maturity, one week.

The final example concerns a digital on the worst of six underlyings. The analytical pricing of this option is possible thanks to the cumulative multi-normal. Using only 10,000 simulations we extract the representation of the value function. Using this representation we can price the option under an exhaustive list of scenarios. This list consists of all combinations of bumping scenarios; Each of the six assets being bumped up or down gives 64 scenarios, two to the power of six. We compare the prices obtained with the regression representation with the analytical prices. The following graph summarises the excellent fit for these entire scenarios.

Conclusion
The method presented in this paper allows the user to produce all the Greeks for the cost of one Monte Carlo simulation. The SVD projection also provides valuable information about confidence interval of the different coefficients of the regression and therefore for the Greeks.
 |
| Adil Reghai |
This week's Learning Curve was written by Adil Reghai, a foreign exchange derivatives quantitative analyst at Merrill Lynch International in London. The author would like to thank Marco Avellaneda and Adrian Howarth for their contribution to this article and David Besancon for his guidance.


