Traditional risk measures such as value at risk (VaR) and expected shortfall (ES) have serious limitations and their use can lead to undesirable outcomes. A new family of more general risk measures has substantial benefits and can be easily implemented to improve risk control and risk-adjusted performance metrics for derivatives market participants.
Some of the most important new developments in financial risk management in recent years have come from the theory of coherent risk measures. These risk measures can be regarded as weighted averages of VaRs, where the weights satisfy certain desirable properties. The best known coherent risk measure is the ES, which also known as the expected tail loss. The ES goes a step beyond VaR by providing an indication of the expected size of losses beyond VaR: it tells us what we can expect to lose, if we experience a loss exceeding VaR.
Coherent risk measures have various attractions. Most importantly, they satisfy the property of subadditivity, which says that adding individual risks together does not increase overall risk. This property makes them superior risk measures to the VaR, which is not subadditive.
Not all coherent risk measures, however, are equally good. We can clearly see this point with an example.
Let's assume that we have two portfolios with the following VaR at various confidence levels. At the 95% level, both portfolios have the same VaR (of USD10 million), and yet portfolio B is more risky than portfolio A, because it gives greater probabilities of higher losses (i.e., it has a fatter tail). Thus, the VaR gives us a misleading impression of the relative riskiness of the two portfolios.
This much will come as no surprise. What is perhaps more surprising, however, is that the two portfolios have the same ES as well: the ES in both cases is USD16 million. This tells us that the ES can also give a misleading indication of the relative riskiness of two portfolios. In this example, the ES is 'blind' to the greater riskiness of portfolio B because it assumes that the risk-taker is only concerned with the average size of losses in excess of the VaR, and not with the broader distribution of such losses.
The root of the problem is that neither risk measure takes proper account of the user's risk aversion.
Spectral Risk Measures
From this simple analysis, it is clear that we need a more general risk measure that explicitly takes account of the user's risk aversion function. This is where spectral risk measures come to the rescue.
A spectral risk measure can be regarded as a weighted average of losses (or VaRs) at all possible confidence levels, where the weights chosen reflect not just the probabilities associated with the losses but the strength of the user's risk-aversion. In other words, if two users are faced with the same distribution of possible losses, a spectral risk measure indicates that the more risk-averse user faces a higher risk.

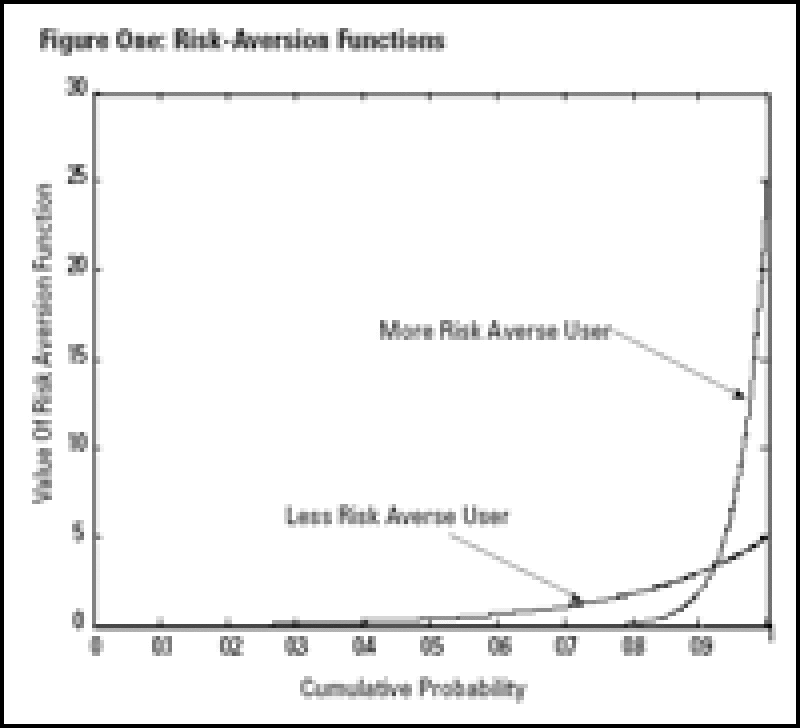
The key to spectral risk measures is therefore the risk-aversion function. A reasonable example is an exponential risk-aversion function. The values of such a function for various cumulative probability levels are presented in Figure One. For more details on the actual formulation of the exponential risk aversion function and estimation of spectral measures.
The more risk-averse the user, the more rapidly the risk-aversion weights rise as the cumulative probability or confidence level rises. We also see that the more risk-averse user gives high losses (associated with the high cumulative probabilities on the right-hand side of Figure One) a higher risk-aversion weight.
To qualify as a spectral risk measure, the weighting function must satisfy certain natural properties. In particular, it must imply that the weights are positive, integrate to one over the probability range [0,1] and rise as the cumulative probability gets bigger. If these conditions hold, then the resulting risk measure will also be coherent, and therefore have the various attractions of coherent risk measures, such as subadditivity.
Estimating coherent or spectral risk measures is also straightforward. If an institution already has a VaR engine, then that engine needs only small adjustments to produce estimates of coherent or spectral risk measures: indeed, in many cases, all that needs changing is the last few lines of code in a long program. This means that the costs of switching from VaR to more sophisticated risk measures are very low.
Despite the substantial investment made in developing or implementing sophisticated risk measurement systems and risk-adjusted return metrics, the choice of the wrong risk measure such as VaR could seriously limit its effectiveness. Risk always finds the weakest link, and that weakest link should not be the risk measure itself.
| VaR and Expected Shortfall (millions) | ||||||||
| VaR for various confidence levels | Risk @95% | |||||||
| Capital | 95% | 96% | 97% | 98% | 99% | VaR | ES | |
| Portfolio A | 100 | 10 | 13 | 17 | 20 | 20 | 10 | 16 |
| Portfolio B | 100 | 10 | 10 | 10 | 10 | 40 | 10 | 16 |
This week's Learning Curve was written by Carlos Blanco, a managing director of Black Swan Risk Advisorsin Berkeley, Calif., and Kevin Dowd, professor of financial risk management at Nottingham University Business School.


