The Event Model
For most companies, one day appears the same as another and the pace of economically significant news is relatively random. For certain companies, however, the news flow tends to be lumpy, that is large one-day moves will be surrounded by periods of moving with the market and outcomes can be binary in nature. The most obvious category of such stocks is the biotech sector, wherein valuations are driven by long-term expectations and regulatory/scientific announcements come on a somewhat predictable schedule. On a shorter time scale, most stocks will follow a similar pattern around earnings announcement dates.
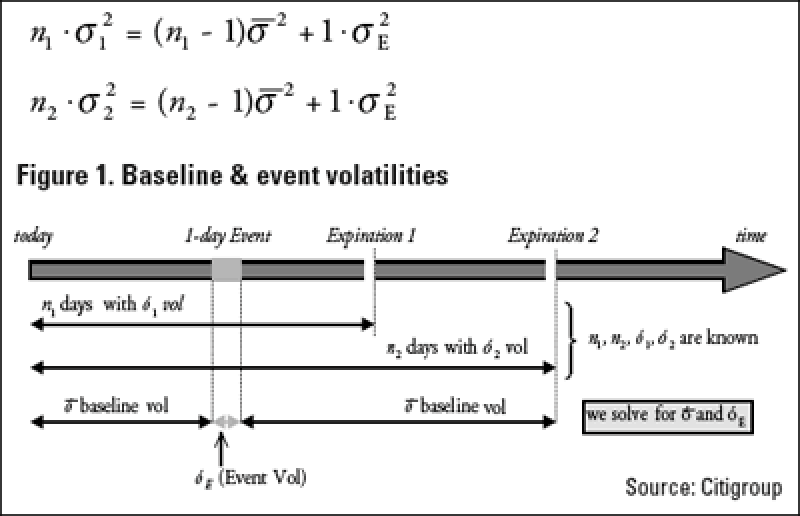
If we assume that, over a given time span, one day is the same as another except for one specific day, then we can observe market prices for the options and imply certain volatilities. Generally, we consider at-the-money options with maturities on the two nearest listed dates though implied variance levels should be used where available. With the implied volatilities for the two dates, we break down each volatility number into the "baseline" volatility and the "event" volatility, and therefore write a system of two equations with two unknowns:

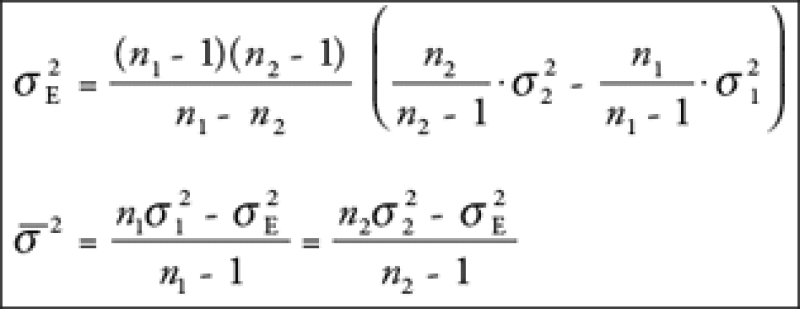
Solving algebraically, we get the following unique solutions:

To turn them into the one-day moves, it is a simple matter of dividing by the annualization factor and taking the square root, as follows:

What The Numbers Mean
At the end of the process, we have two numbers that look like one-day percentage moves. Under the assumptions of the model, they represent the fair expectation of a one-day move and the average daily move over the rest of the period.
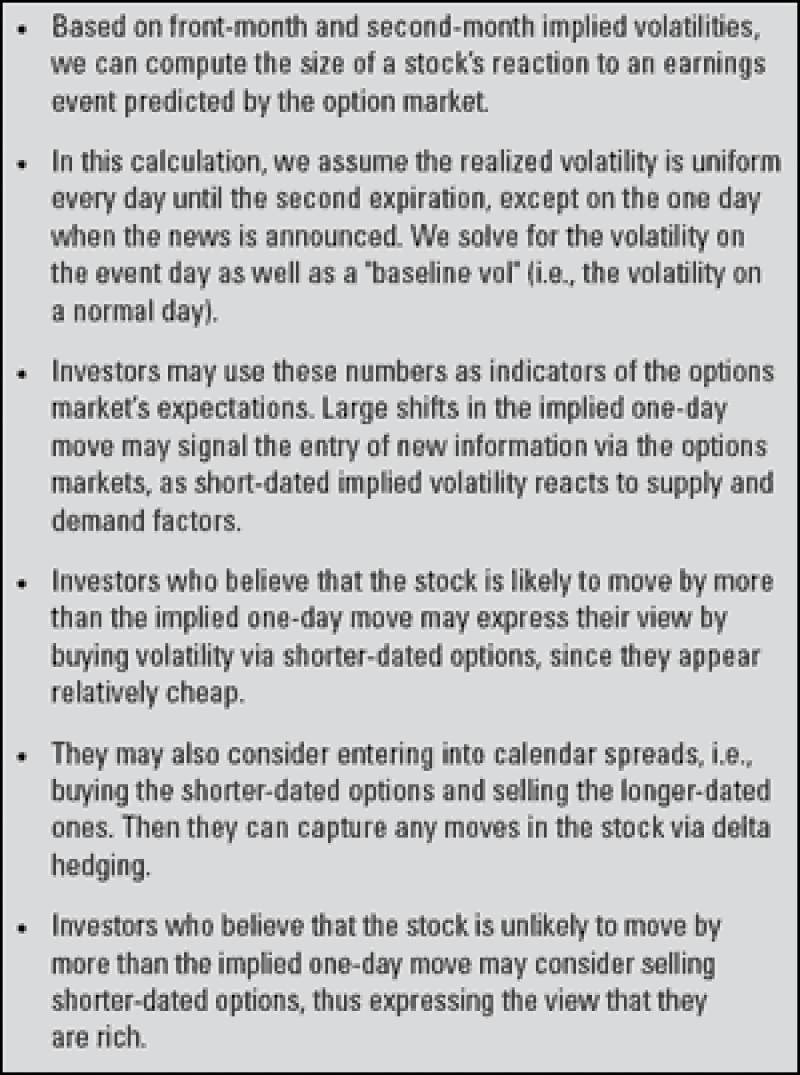
Investors may use these numbers as indicators of the options market's expectations, particularly if they track them leading up to the event. Large shifts in the one-day move may signal the entry of new information via the options markets, as short-dated implied volatility reacts to supply and demand factors.
Investors who believe that the stock is likely to move by more than the implied one-day move may express their view by buying volatility via shorter-dated options, since they appear relatively inexpensive. Investors who believe that the stock is unlikely to move by more than the implied one-day move may consider selling shorter-dated options, thus expressing the view that they are rich.
They may also consider entering calendar spreads, that is buying the shorter-dated options and selling the longer-dated ones. If they ratio the trade such that they are premium-neutral, they will be long gamma initially and can thus capture any moves in the stock via delta hedging.
Deutsche Bank: A Case Study
We consider Deutsche Bank short-dated vol a week before their earnings announcement scheduled for April 30. At the time, the May and June-expiration listed options implied a one-day earnings move of 2.84% with a baseline daily move of 1.39% for the rest of the period. More significantly, the implied one-day move had dropped from 4.55% the day before, in part because the whole curve sold off.
Investors could buy the May EUR70-strike puts for EUR0.97, at a 23.6% implied vol, and sell the June EUR70-strike puts for EUR2.13, at a 22.5% implied vol.
On April 30, shares traded down from EUR70.3 to EUR68.75, for a drop of 2.2% on the day. On a directional basis, the severe drop in the implied one-day move statistic served to be a good indicator that the put options were inexpensive.
* Investors who had bought the May EUR70 strike puts on
our offer shown above could have closed out their
positions on April 30 for EUR2.19 or a profit of
EUR1.22, which represents a return of 126% in a week.
Or, they could have held their positions through
expiration when the stock traded down to EUR66.3 and
made EUR2.73 per option.
* On a vol basis, the stock realized 26.3% in volatility points
from April 23 to option expiration on May 21. As an
estimate, a trader who delta-hedged on the close could have
made 2.7 vol points on their position.
* We also consider the calendar spread idea. For simplicity, we
assume the investor entered a premium-neutral (buy 2.196
May EUR70 puts at EUR0.97 and sell one Jun EUR70 put at
(EUR2.13) trade. On April 30, they could have closed out
the positions for EUR2.19 and EUR3.87 respectively, for a
profit of EUR0.94.
The profitability of these particular trades depended on many different factors, including shifts in investor attitudes towards interest rate-exposed stocks, the evolution of implied vols and the subjective quality of Deutsche Bank's results, so past performance is no guarantee of future results. The one-day move model should not be used for visibility into these factors of the stock price. Rather, the number represents a stylized picture of investor expectations, and can be useful in providing a sense of "richness" and "cheapness".
This week's Learning Curve was written by Art Lu, equity derivatives research analyst at Citigroup in London.


