Strategies involving both equity and credit products have become increasingly popular, under the pressure of both an overall decrease in market volatility and structural changes among alternative investment strategies. Playing credit against equities relies on the assumption there is indeed a correlation between both markets and equities may provide an efficient hedge for pure credit positions. In this article, we focus on marked-to-market risk, as opposed to pure credit risk. Proving a dynamic strategy based on equities can stabilise the marked-to-market of credit portfolios, this would not only have outstanding applications for banks or credit portfolio managers, it would also establish the relevance of dedicated equity-credit arbitrage strategies.
This Learning Curve focuses on strategies involving only credit default swaps and stocks. The theoretical background of the analysis is a reduced-form model we call the EC-Hedge model (for equity-credit hedge). By contrast to most approaches based on the Merton model, the EC-Hedge model uses the information brought by the equity derivatives market and not debt numbers, which are a source of uncertainty.
A Reduced-Form Model For Estimating Hedge Ratios
The purpose of the EC-Hedge model is to stimulate hedge ratios between CDS (or other directional credit positions) and stocks. The reduced-form approach describes default risk as an exogenous process with a specific short-term intensity. Popular models for convertible bonds use the stock price as a driving force for this intensity of default.
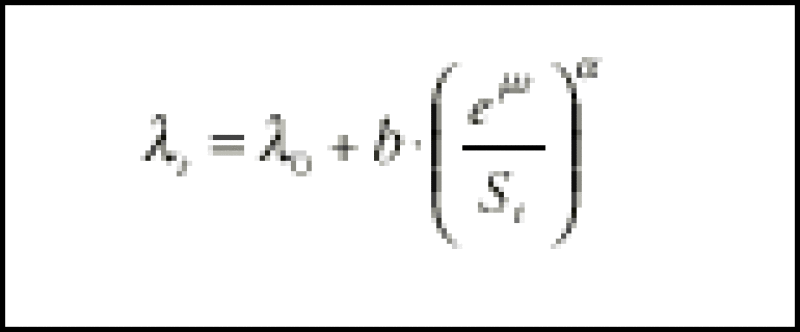
The EC-Hedge follows this approach. It is fitted to the stock price of a company, a CDS spread and a quotation for an equity option (typically, a one-year at-the-money put). Making the link between the stock price and the value of an equity option is the basics of options pricing theory. What is trickier is relating the CDS spread to the equity quotations. This is done through a simple relationship between short-term default risk and stock price. The model postulates that:

* represents the short-term default risk. *0 is a component of default risk that is not related to the stock price (the pure credit component). µ is a growth rate parameter used to adjust against the natural growth rate on the stock price. It is noted as the debt growth rate and is usually set to the differential between riskless rates and the dividend paid by the stock. The key parameters in this relationship are the b and *:
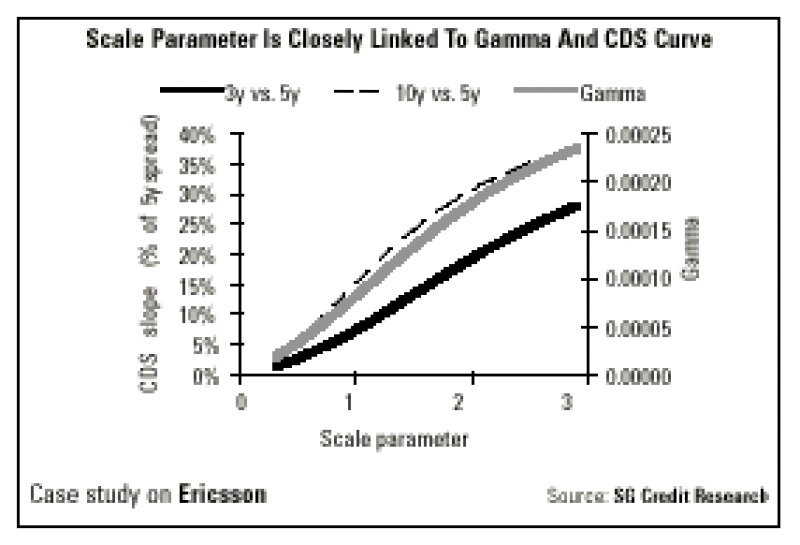
* is a scale parameter that helps quantify the impact of sharp changes in stock prices on credit spreads.
b is a credit-equity sensitivity parameter. It plays a central role in the relationship between the stock price and default risk and therefore has a direct influence on hedge ratios.
Whereas the *0, µ and * are set either arbitrarily or based on a statistical analysis, the credit-equity sensitivity parameter is directly inferred from the credit spreads and equity implied volatility. This is one of the striking features of the model: the credit-equity sensitivity is priced by forward-looking market data, instead of a backward-looking statistical analysis.
Put options benefit from the default of the company and therefore the stock volatility implied by the EC-Hedge model is lower than the traditional Black & Scholes implied volatility. The model is quite simple in terms of equity volatility. It assumes a constant volatility and differentiates itself from the Black & Scholes framework only through the default risk. A more complete approach would take into account the whole volatility smile.
Different Types Of Trading Strategies
One can highlight three main types of strategies involving credit and equities:
Arbitrage strategies involve long-term trades with a view to hedge default risk as much as possible. The idea is the credit market may pay a higher or a lower risk premium than the equity derivatives market, offering an opportunity to play a CDS against a combination of equity derivative products while stripping out a major part of the risks and retaining a premium. A typical arbitrage strategy would involve selling a CDS and buying an equity-default swap (EDS), on the basis of a specific assumption on the loss rate in case of a credit event.
Relative value trades try and take profit from divergences between correlated markets. They bet on a convergence between credit and equity markets.
Convexity trades try to avoid the kind of bet involved in relative value trades. By contrast to arbitrage trades, they do not necessarily search for opportunities in which one market pays higher risk premiums than the other. They search for cheap convexity typically offered by tight credit spreads against a volatile stock. The danger with convexity trades is the stock price may well fall without any significant change on the credit side, or even worse, a good credit performance. This is why it is best to combine a positive gamma with the right assessment of relative value.

Estimating The Scale Parameter
The scale parameter (the *) quantifies how sharp changes in stock price influence credit spreads. It has a direct influence on second-order risks, or the assessment of convexity in the relationship between credit and equity.
Our choice for the * has been to fix it based on a statistical analysis on cross-over names such as Alcatel. Another choice would be to estimate a different parameter separately for each issuer. The problem with such an approach is twofold. First, it would be extremely backward-looking. Second, some highly-rated issuers have not yet experienced a sharp rise in credit spreads, which does not mean that such an event shall never occur.

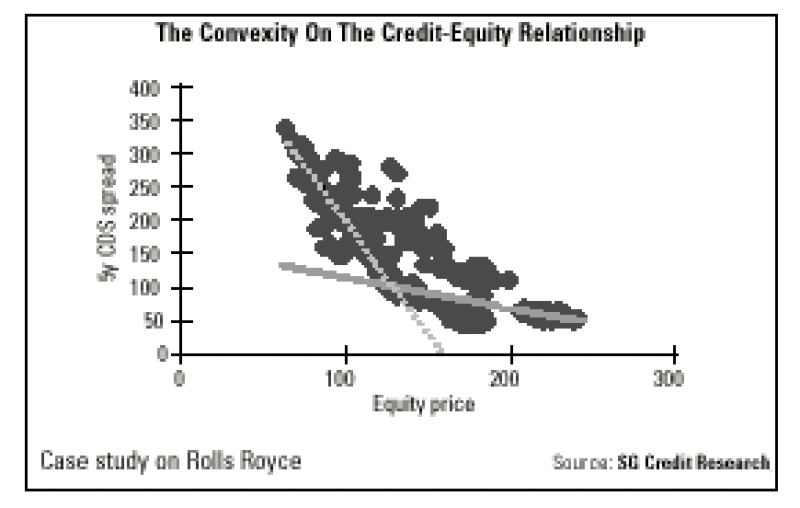
Indeed, the curvature in the equity-credit relationship becomes apparent when spreads widen quite significantly. Otherwise, the length of the historical data does not make it possible to obtain a precise view of convexity. On the index level, the relationship is even pretty well approximated by a straight line.
Looking at historical data, the curvature on the equity-credit relationship is most striking when credit spreads trade around 100-200 basis points. Outside this range, it becomes more difficult to distinguish one a estimate from another. In the case of Rolls Royce, that is being outlined here, the scale parameter is indeed close to two. The question now is how this number compares to estimates on other issuers.
On the market-level, a statistical estimate for the scale parameter tends to be closer to 1. The estimated scale parameter is lower for issuers whose spread has been either consistently tight or wide, just as one would expect looking at our data on Rolls Royce. Between these two limit cases, the estimated scale parameter tends to be higher and our choice for an estimate at 2 is quite in line with observation on an issuer whose spread has been on average around 100-200 basis points. There is indeed a lot of uncertainty on the exact level of the scale parameter and whether it should at all be constant across various issuers. Only a back-testing analysis will give a real insight into whether the model is performing well and whether our choice for the a is relevant, which will examined in next weekís article.
This week's Learning Curve was written by Julien Turc, strategist in the quantitative credit strategy group at Société Générale in Paris.


