Nearly $15tr are currently invested worldwide in equity, debt and projects according to environmental, social and governance (ESG) criteria. Roughly $9tr are in Europe, over $4tr in the US and the rest distributed across Asia, Africa and Latin America.
ESG investing — or socially responsible investing (SRI), as it is also called — has taken off since 2010 as a way to mitigate risk while still maintaining a profitable exposure to equities in particular. The theory is that SRI assets are better managed over the long term and thus are lower risk while still promising higher returns over time.
The US market is seeing the strongest growth, with a compound annual growth rate (CAGR) of between 20% and 30% in assets under management (AUM) since 2010. The question is whether SRI can truly be linked to the stronger financial performance it promises or if it is simply a marketing ploy for driving sales of common financial instruments.
Additionally, there are no strict criteria for what is considered an SRI asset. Even companies with relatively poor actual governance are often considered SRI leaders, including banks that have been fined billions by regulators since the global financial crisis.
Investors use various approaches to assess the ESG performance of companies. The most popular is screening investments in constituting portfolios (used by 70%), followed by shareholder activism in the form of shareholder resolutions (50%).
Pension funds are among the major investors in the SRI hype. Faced with the need to generate higher returns at a controlled risk level, they have been flocking to the sector. Such is the pressure on returns and the difficulty in finding suitable assets, that the biggest wealth fund in the world, Norway's sovereign wealth fund, which wields more than $900bn, has in the past even considered investing in high risk countries such as Ukraine in an attempt to achieve a 4% net annual return.
This backdrop makes ESG a potentially compelling proposition. Recent studies have found that so far most ESG investments are outperforming their non-ESG counterparts. A 2012 study by Deutsche Bank, which covered a mix of 156 academic studies and research papers, revealed that all 100 of the academic studies showed positive correlations between ESG performance and lower costs of capital, and thus lower risk.
In another study by Mercer (2011), which looked at 36 studies of ESG performance, 30 displayed better results for ESG investments.
Missing link
But the bottleneck in ESG research and analysis is the lack of data linking sustainability and ESG data to financial performance at company and project levels. A 2012 Bank of New York Mellon study revealed that between 50% and 60% of the analysts surveyed thought they needed help in analysing ESG data, and wanted companies to improve their reporting practices.
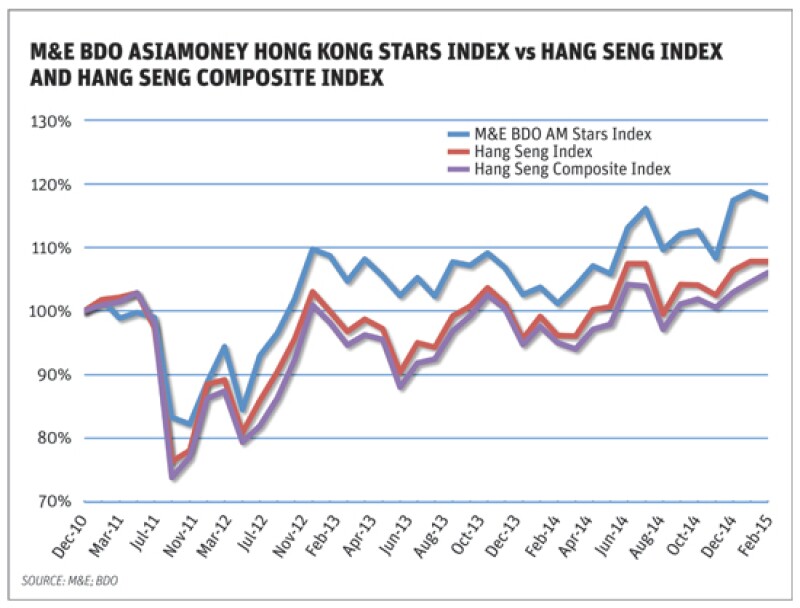
Against this background, Management & Excellence (M&E), together with BDO Financial in Hong Kong and Asiamoney, launched the Hong Kong Sustainable Stars Index over two years ago, which financially quantifies the ESG and broad management performance of 23 of Hong Kong's and China's most sustainable blue-chips.
Using an in-depth approach, the Index has been outperforming the Hang Seng and Hang Seng Composite Indexes since shortly after its launch in 2011 (see chart on previous page). It considers 250 to 300 data points that relate good ESG performance to financial performance and has translated into stronger equity price performance.
CASE STUDY: CLP
Even companies considered to be ESG leaders, such as energy giant CLP, have a long way to go in order to report ESG in a financially transparent manner. CLP, a company in the Dow Jones Sustainability Index and the HK Sustainable Stars Index, achieves a performance score of 63.8/100 according to the HK Sustainable Stars Index, which puts it in second position among the 21 index components. Power Assets, a competitor that is ranked fourth in the index, achieves a rating of 59.8.
The M&E/BDO method uses ratios and indicators that fall into three categories: those impacting a company's top line, its margins and its value. The point here is to link ESG-related costs to financial results instead of simply describing them in qualitative terms, which is how much of the Global Reporting Initiative (GRI) framework works. The GRI is a commonly used metric for structuring ESG reporting.
In Table 1 we cite three examples of the roughly 40 ratios used in the M&E/BDO system. All ratios reveal the relationships between costs and related returns. The Return on Management (ROM) ratio tells investors how much net income they are getting for each Hong Kong dollar they are paying directors and senior executives. It is a simple and accurate gauge of management effectiveness.
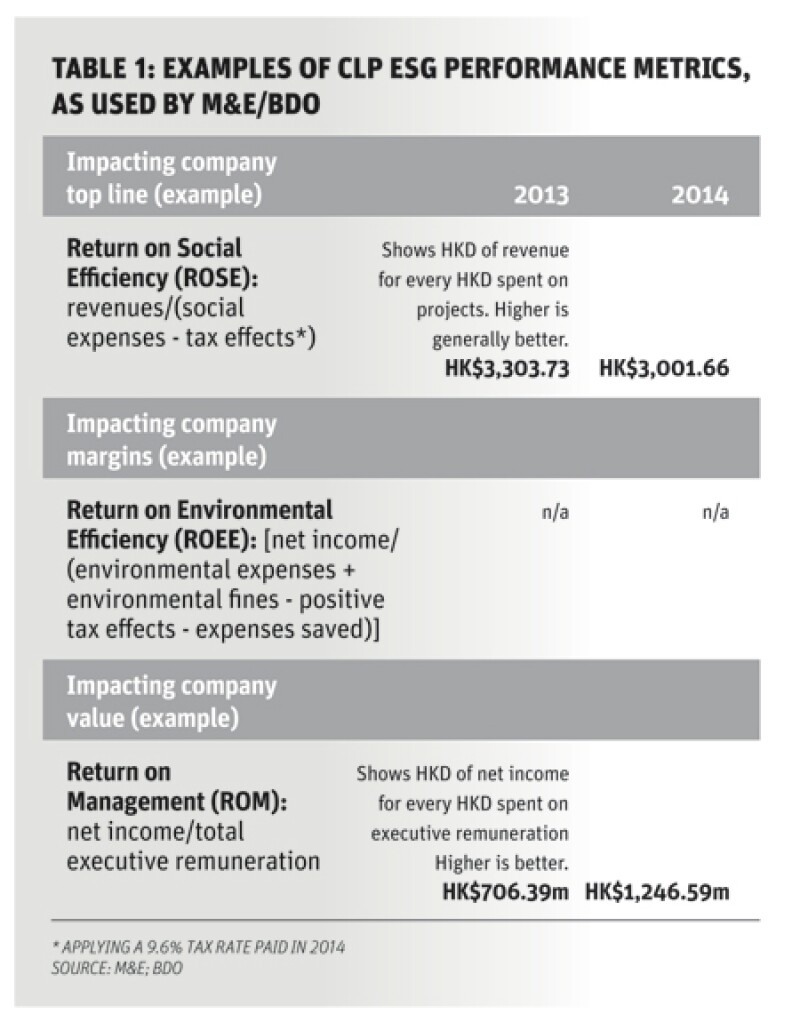
Accordingly, in 2014 shareholders got nearly HK$540.20 more in net income per HK$1.00 paid to the company's leadership, which is a jump of 76.5%, although earnings increased by 85%. Thus, CLP's total remuneration of its leadership outpaced its increase in earnings by 8.5%.
Similarly, social and cultural expenses are increasing at a faster rate than earnings. This kind of impact accounting allows analysts to identify companies that might be forfeiting profits and shareholder value.
While governance data such as executive and director remuneration are readily available, ratios in the other areas, such as environmental projects, reveal the glaring weaknesses of today's reporting on ESG matters. Analysts often search in vain for such basic environmental numbers as the amount spent on environmentally related projects in 2014 or 2013 and the savings in resource consumption generated.
Embedded in lengthy texts on policies, CLP does cite the legal fines it incurred (e.g. the equivalent of HK$116m in 2014 by the Ho-Ping facility in Taiwan). But numbers about changes in the carbon density of emissions do little to indicate current or positive impacts of environmental projects on margins.
Analysts who wish to determine the impact of environmental policies on regulatory risk and thus future cash positions, are pained by having to read through a lot of text that is thin on financially relevant data. Indeed, there are no data on the returns of investment (ROI) of individual ESG projects. Thus, there is no way of knowing if these projects were worth it — that is, if they are delivering returns at or above investors' required rate of return (the discount rate).
Pages of checkmarks to financially irrelevant policies and information according to GRI standards tend to cloud the issue of whether ESG projects are having any meaningful impact.
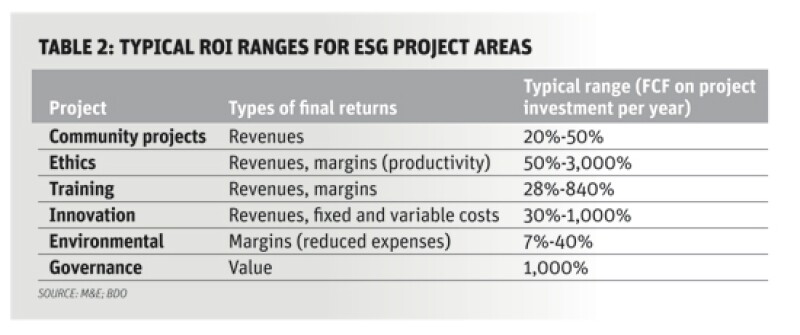
Yet methods do exist to measure accurately the ROI of ESG projects, such as M&E/BDO's Return on Sustainability ROS(R) method, which has been in use since 2007 on over 80 projects worth over $5bn (see Table 2 for typical ROI ranges for ESG project areas).